- Jul 16, 2025
Process Approach, Mapping & Analysis: Foundations for Operational Excellence
- David Lapesa Barrera
In previous articles, we explored the importance of Business Process Mapping (BPM) and Value Stream Mapping (VSM) as powerful tools to visualize and optimize workflows in aviation. These concepts provide a clear view of how work flows and where inefficiencies lie, helping airlines and aviation organizations improve safety, efficiency, and customer satisfaction.
Now, it’s time to get hands-on. In this article, we’ll dive into the practical side of process improvement — how to document, analyze, and enhance your workflows using proven mapping tools like flowcharts, swimlane diagrams, BPMN, SIPOC, Makigami, and the RE Method.
Understanding the Process Approach
The process approach means looking at your organization as a collection of interconnected processes rather than isolated tasks or departments. Each process has inputs, activities, and outputs that contribute to delivering value to your customer — whether that’s a passenger, cargo client, or internal stakeholder.
If you’re familiar with Lean methodologies, you know that anything that doesn’t add value to the customer is considered a non-value-added activity — and most of these should be eliminated or minimized. Recognizing and mapping these processes is crucial because it brings clarity to your operations. It helps everyone understand their roles, how they fit into the bigger picture, and where improvements can be made by focusing on value-adding steps and removing waste.
Documenting Processes with Flowcharts and Swimlane Diagrams
The first step in mastering process mapping is documenting your current workflows visually. Two of the most accessible tools for this are flowcharts and swimlane diagrams.
Flowcharts use symbols and arrows to represent each step in a process sequentially. This makes it easy to see the overall flow of activities, decisions, and outcomes. Because of their simplicity, flowcharts are great for documenting how a process currently works, helping teams align on what happens and when.
But flowcharts are not just for documentation—they also serve as powerful analysis tools. By visually laying out the process, you can quickly spot unnecessary steps, loops, or bottlenecks that slow down operations or add complexity. For example, repeated decision points or back-and-forth arrows may signal inefficiencies or potential points of failure.
Swimlane diagrams take this one step further by organizing the steps into lanes that represent different roles, departments, or systems involved in the process. This structure helps clearly document who is responsible for each task and highlights handoffs between parties.
From an analysis perspective, swimlane diagrams make it easier to detect communication gaps, delays during handoffs, or duplicated work between teams. These insights are invaluable in collaborative environments like airlines, where seamless coordination between multiple functions is critical.
Standardizing with Business Process Model and Notation (BPMN)
While flowcharts and swimlane diagrams are excellent tools for documenting and analyzing processes, Business Process Model and Notation (BPMN) takes this a step further by providing a standardized and precise language for process mapping. Think of BPMN as a universal way to standardize flowcharts and swimlane diagrams, using a consistent set of symbols and rules that everyone across the organization can understand.
BPMN incorporates key elements such as events (things that happen), tasks (work to be done), gateways (decision points), and flows (the sequence of activities), creating detailed and unambiguous process maps. This formal notation ensures that what you see on the map precisely reflects the process, avoiding misinterpretation or ambiguity often found in informal diagrams.
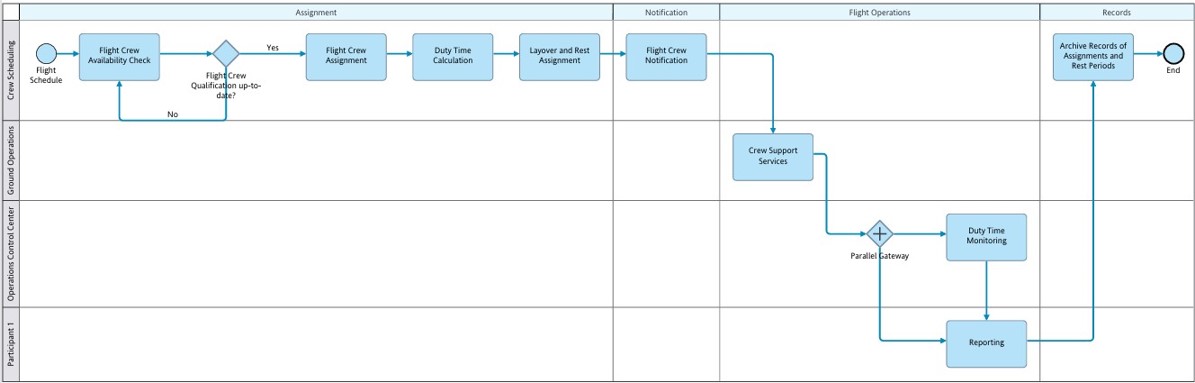
In aviation, where processes often involve strict regulatory compliance, multiple stakeholders, and complex systems integration, BPMN helps create maps that are not only clear but also consistent and reliable. This standardization is crucial for training, audits, process automation, and cross-functional collaboration, enabling organizations to align operations and support continuous improvement efforts with confidence.
Mapping for Process Analysis: SIPOC, Makigami, and Value Stream Mapping
During process improvement exercises, several complementary tools can be used to gain a comprehensive understanding of workflows and identify opportunities for waste reduction and efficiency gains.
SIPOC (Suppliers, Inputs, Process, Outputs, Customers) provides a high-level overview that clearly defines the scope of a process and the relationships between its key elements. By outlining who supplies inputs, what those inputs are, the major process steps, what outputs are produced, and who the customers are, SIPOC helps align all stakeholders on the boundaries and essential components of the process. This clarity is vital for setting the foundation for deeper analysis and focused improvement efforts.
Building on this foundation, Makigami focuses specifically on the flow of information, materials, or paperwork—particularly within administrative or support processes. Don’t be misled by the name — Makigami is essentially a specialized type of flowchart or swimlane diagram enriched with detailed information. By mapping these flows in detail, Makigami exposes delays, redundant steps, and bottlenecks that may not be obvious at a higher level. This insight is crucial for streamlining back-office functions that directly impact overall process performance and timeliness.
Value Stream Mapping (VSM) is used for a more detailed and end-to-end view of how value is delivered to the customer. VSM captures the complete flow of activities and information, distinguishing value-added steps from waste. This visualization makes it easier to identify points where delays, rework, or unnecessary tasks disrupt the smooth delivery of services. For example, in the aircraft turnaround process, VSM can reveal how inefficiencies in fueling, cleaning, or boarding cascade to affect on-time departures, guiding teams to prioritize impactful improvements.
Together, SIPOC, Makigami, and Value Stream Mapping form a powerful toolkit that addresses process analysis at multiple levels: SIPOC establishes scope and relationships, Makigami highlights inefficiencies in information and support flows, and VSM provides a holistic picture of value creation. Using these tools in combination enables aviation organizations to pinpoint areas for improvement, reduce waste, enhance operational efficiency, and ultimately deliver better safety and service to customers.
Bringing It All Together: Lean in Aviation
Process mapping and analysis are not one-off activities but continuous cycles of learning and improvement. When embedded in a Lean culture, these tools empower frontline teams to identify problems, test solutions, and standardize best practices.
Learn to document, analyze, and optimize airline processes →
Author
David Lapesa Barrera is the founder of The Lean Airline® and author of The Lean Airline: Flight Excellence and Aircraft Maintenance Programs. His work focuses on lean management, operational excellence, and continuing airworthiness.