- Jun 3
The Turnaround Value Stream of a Wide-Body Aircraft
- David Lapesa Barrera
In a previous article on Value Stream Mapping (VSM), we introduced the concept of visualizing how value flows across an organization from end to end. To move from theory to practice, it is useful to apply this approach to a real operational environment.
A simplified but representative example is the aircraft turnaround process for a wide-body aircraft, from its arrival at the gate until its departure for the next flight.
This process involves multiple functions performing specific activities under strict time constraints, often in parallel and with strong interdependencies.
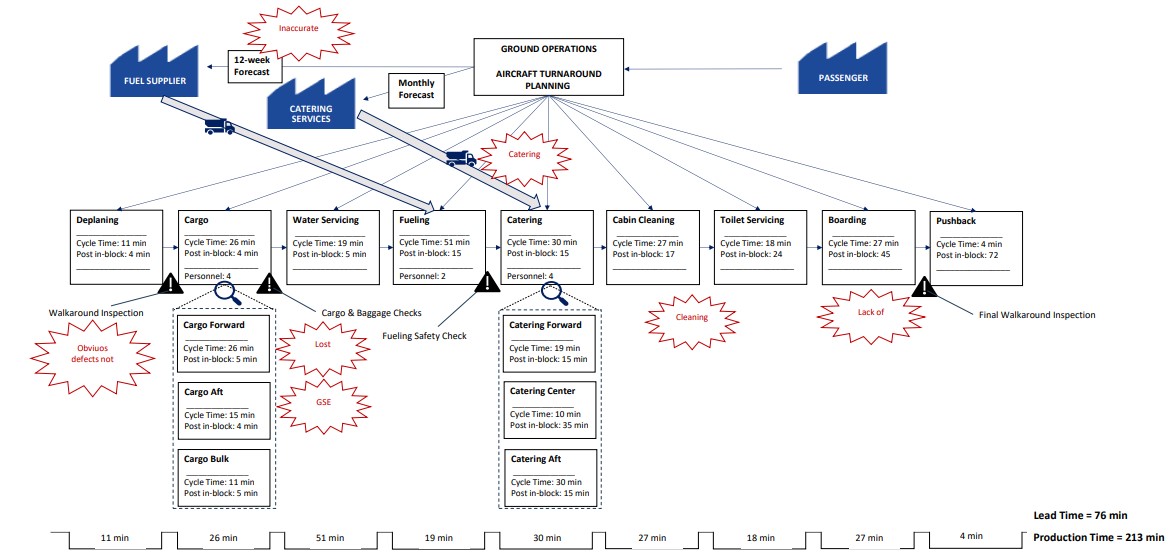
The Turnaround Value Stream
The aircraft turnaround begins immediately after arrival at the gate and includes a series of coordinated activities:
Deplaning starts shortly after arrival and takes 11 minutes. This marks the first step in preparing the aircraft for the next flight as passengers disembark.
Cargo handling (forward, aft, and bulk) involves loading and unloading baggage and cargo. Each stream has different starting points and durations. For example, forward cargo unloading begins 5 minutes after arrival and takes 26 minutes.
Potable water and toilet servicing are essential activities for passenger comfort and safety. These occur at different points within the turnaround process and must be completed before departure readiness.
Fueling begins 15 minutes after arrival and takes 51 minutes. Fuel planning plays an important role in this process, as fuel requirements are typically forecasted 12 weeks in advance. This forecasting supports cost control, budgeting, supplier negotiation, and preparation for price fluctuations.
Catering loading (forward, center, and aft galley) is performed in parallel across different aircraft sections. These activities ensure onboard service readiness and vary in timing and duration depending on operational requirements.
Cabin cleaning starts 17 minutes after arrival and takes 27 minutes. It ensures the aircraft cabin is prepared for the next set of passengers and meets required service standards.
Boarding begins 45 minutes after arrival and takes 27 minutes. This is one of the final stages before departure and depends on the completion and coordination of several preceding activities.
In this simplified example, the total lead time is 76 minutes, representing the time from aircraft arrival to readiness for departure. The total production time is 213 minutes, representing the cumulative duration of all activities involved in the turnaround process.
Understanding the Value Stream
When these activities are mapped together, the focus shifts from individual tasks to the overall flow of work.
The aircraft turnaround is not a linear process. It is a system of parallel activities that must align within a fixed time window. Each function operates within its own scope, but all contribute to a shared outcome: departure readiness.
This perspective makes it possible to see how dependencies shape the process. For example, delays in cargo handling may affect boarding readiness, while delays in cabin cleaning can directly impact passenger boarding. Even when tasks are technically separate, they are operationally connected through timing and resource availability.
Value Stream Mapping helps make these relationships visible by showing how work actually flows across the system rather than how it is structured on paper.
Waste and Operational Issues in the Process
By examining the full value stream, several sources of waste can be identified:
Inaccurate fuel forecasting, which leads to misalignment between budget planning and actual fuel costs, particularly under fluctuating market conditions
Defects not identified during initial walkaround inspections, which are only discovered later in the process and cause delays
Lost baggage, requiring recovery efforts by ground personnel and disrupting the boarding process
Cargo Ground Support Equipment (GSE) issues, such as malfunctioning loaders or conveyor systems, slowing down cargo operations
Delays in cabin cleaning, which directly affect boarding readiness and overall turnaround time
Shortages of ground personnel during boarding, resulting in longer boarding times and extended lead time
Each of these issues introduces variation into the process. While they may appear operational in nature, their combined effect is reflected in increased turnaround time and reduced schedule reliability.
System-Level Perspective
In all these cases, the impact is not limited to a single activity. A delay in one part of the value stream can influence downstream steps, affecting coordination across teams and functions.
This is one of the key insights of Value Stream Mapping: performance is not defined by individual efficiency alone, but by how well the entire system is aligned.
In aircraft turnaround operations, this system view is particularly important. Multiple stakeholders work in parallel under strict time constraints, and small disruptions can propagate quickly across the process.
Conclusion
This example illustrates how Value Stream Mapping can be applied to a real operational process in aviation. By mapping the aircraft turnaround end to end, it becomes possible to understand not only what activities take place, but how they interact, where delays emerge, and how value is ultimately delivered.
The goal is not only to observe the process, but to see it as a connected system where coordination and flow determine performance. The same thinking can be extended to other aviation processes, such as maintenance planning, crew scheduling, baggage handling, or flight operations, where value is also created through interdependent activities rather than isolated tasks.
Learn more about process mapping and analysis →
Author
David Lapesa Barrera is the founder of The Lean Airline® and author of The Lean Airline: Flight Excellence and Aircraft Maintenance Programs. His work focuses on lean management, operational excellence, and continuing airworthiness.