- Jun 11, 2025
Catch the Causes: Fixing Problems with the Fishbone Diagram
- David Lapesa Barrera
The Cause and Effect Diagram, also known as Ishikawa or Fishbone Diagram, is a root cause analysis tool that provides a visual representation of potential causes for a specific problem. It allows to view all the contributing factors at once, easing to identify whether the same root cause appears in multiple causal chains.
Initially developed by Dr. Kaoru Ishikawa to improve quality control in Japan's manufacturing industry, it has since found widespread use in various sectors, including aviation.
How the Fishbone Diagram Works
The Cause and Effect Diagram is structured like a fish skeleton, where the head represents the problem statement, and the bones or main branches represent different categories of potential causes. These categories may include factors such as equipment, materials, methods, environment, and people. Each main branch can further branch out into sub-categories, providing a detailed breakdown of possible contributing factors.
A critical part of the process is ensuring that the problem statement at the head of the diagram is clear and precise. A well-defined problem allows teams to focus on the most relevant causes, ensuring that the diagram remains actionable and productive.
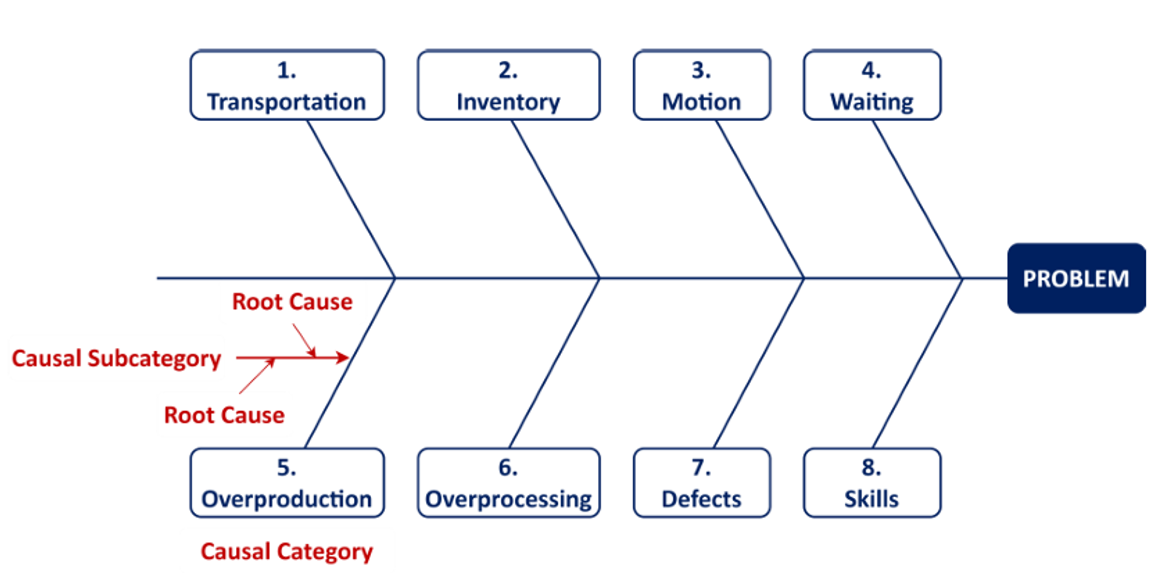
Fishbone diagram based on the TIMWOODS framework.
Integrating with Other Tools
While the Fishbone Diagram is an excellent tool for categorizing and analyzing complex issues, its true power is unlocked when combined with other problem-solving techniques. One common approach is integrating the 5 Whys Analysis to investigate each cause in-depth and determine the true root causes. This combination ensures that teams don’t just address symptoms but tackle underlying problems that impact performance.
To bring these analyses to life, Fishbone Diagrams are often used in Kaizen workshops. These collaborative sessions allow teams to identify root causes together, test solutions on the spot, and embed continuous improvement directly into daily airline operations.”
Customizing the Diagram for Different Contexts
One of the key advantages of the Fishbone Diagram is its versatility. The main categories of causes can be tailored to fit the specific context of the problem. Here are several frameworks you can use to adapt the diagram to different situations:
TIMWOODS (Non-value added activities, Waste): Transportation, Inventory, Motion, Waiting, Overproduction, Overprocessing, Defects, Skills.
5M/1E Model: Machine, Methods, Measurements, Materials, Manpower, and Environment
4S Model: Systems, Surroundings, Skills, and Suppliers
8P Model (Marketing and Strategy): Product, Price, Place, Promotion, People, Positioning, Processes, and Performance
SHELL Model (Human Factors): Software, Hardware, Environment, Liveware (People).
Dirty Dozen (Human Factors): Complacency, Lack of communication, Distraction, Lack of teamwork, Fatigue, Lack of resources, Pressure, Lack of assertiveness, Stress, Lack of awareness, Lack of knowledge, and Norms.
Avoiding Common Pitfalls
While the Cause and Effect Diagram is incredibly effective, it's not without its challenges. A common pitfall in team discussions is the tendency to blame individuals for problems, often referred to as "Man," "Manpower," or "People" in the categories.
This can lead to ineffective solutions, such as providing more training to individuals rather than addressing the root causes tied to organizational processes. To avoid this, it's crucial to redirect the focus from blaming individuals to improving processes, which leads to more productive, results-driven conversations.
Conclusion
The Cause and Effect Diagram is a valuable tool in the problem-solving toolkit of any organization. Whether used alone or combined with other methods like 5 Whys or frameworks like TIMWOODS, it helps teams identify the underlying causes of issues and implement effective solutions. By focusing on process improvement and avoiding the blame game, teams can unlock better outcomes and enhance operational efficiency.
Learn to uncover root causes and solve problems effectively →
Author
David Lapesa Barrera is the founder of The Lean Airline® and author of The Lean Airline: Flight Excellence and Aircraft Maintenance Programs. His work focuses on lean management, operational excellence, and continuing airworthiness.